|
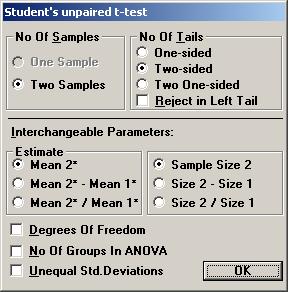
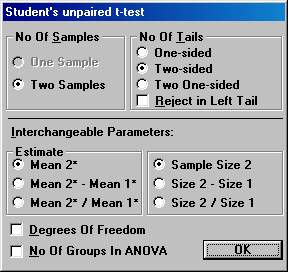
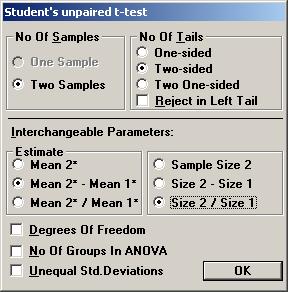
Examples using StudyResult 1.0. Planning a clinical trial A clinical trial is planned to study the effects of a new drug for treatment of patients with chronic heart failure. Of special interest in this trial is the possible change of neurohormones after 40 weeks of treatment and the plan is to make a comparison with placebo. For ethical reasons, the new drug and placebo will be added to a drug already approved and on the market for the treatment of heart failure. One of the most important neurohormone to study in this trial is aldosterone. To gain some knowledge about what effect would be clinically relevant and what variation one would expect, a literature review was started. 1. Calculation of p-value and confidence interval. In one of the early publications of the effects of the existing drug, a table with descriptive statistics for neurohormones was found. The arithmetic mean and the standard deviation of the change in aldosterone were presented in this table. No statistical analysis had been performed. It was considered informative to check post-hoc if the difference in change between the treatment and placebo was statistically significant and to get an interval estimate of this difference, since this information was not in the publication. The descriptive statistics for the change of aldosterone from baseline to the end of treatment (pg/mL) were Mean (SD) n ------------------------------------------------------------------ Placebo 60 (283) 159 Treatment 32 (148) 163 ------------------------------------------------------------------ To calculate the p-value using Students unpaired t-test, Open the File menu and choose New Calculation. Open the Test Procedures menu and choose Students unpaired t-test Choose the option button Two-sided and among the Interchangeable Parameters options Mean 2* and Sample Size 2 and press OK.
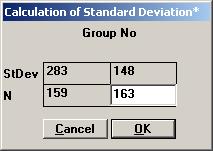
A screen with the parameter values needed for Students unpaired t-test is shown. Tick the input box for Standard Deviation* to calculate the pooled standard deviation for the t-test automatically. Enter the values for the standard deviations for sample 1 and 2 and press OK.
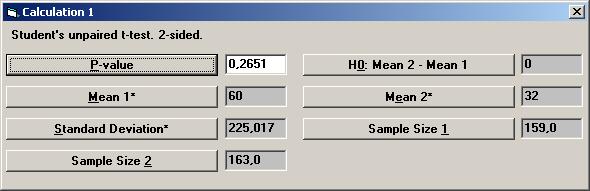
The value 224.824 is shown in the input box for Standard Deviation*. Set the other parameter values except for p-value as shown, and then press the p-value button.
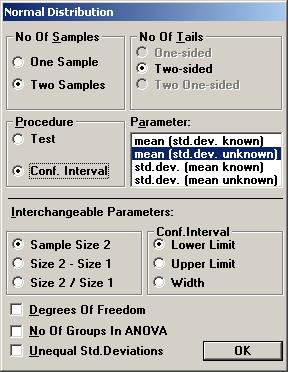
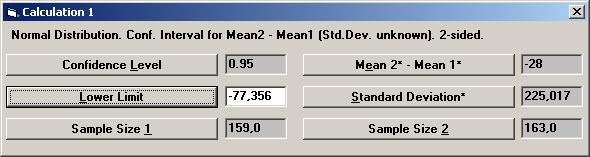
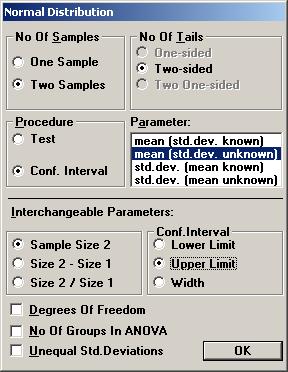
The textbox for P-value will then show the value 0.26681, i.e. there is no statistical significant difference between the treatment and placebo. To calculate a confidence interval for the difference, Open the File menu and choose New Calculation. Open the Sample Distributions menu and choose Normal Distribution Choose the option buttons Two Samples, Two-sided, and Conf. Interval. Choose mean (std.dev. unknown) as the parameter to be analysed. Among the Interchangeable parameters choose Sample Size 2, Lower Limit, and press OK.
If no other parameters have not been used, the same values as before are shown for Standard Deviation*, Sample Size 1, and Sample Size 2. Set the values for Confidence Level to 0.95 and Mean2* - Mean1* to 28 (i.e. 32 60) and press the Lower Limit.
The textbox for Lower Limit will then show the value 77.533, i.e. the left endpoint of a two-sided 95% confidence interval. To calculate the right endpoint, tick the Upper Limit option on the options dialog box and press OK.
If no other parameter has been used, the Lower Limit value is automatically changed to the Upper Limit value, 21.533.
Thus a 95% confidence interval for the difference in mean change between treatment and placebo is [ -77.533, 21.533 ].
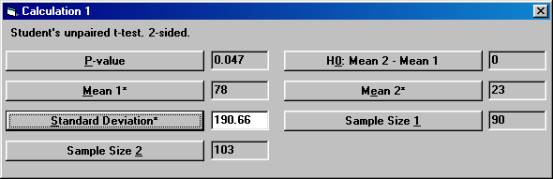
2. Estimation of the variation. Another publication found in the literature review showed a slight significant change in aldosterone for the active drug compared to placebo. The test being used was Students unpaired t-test and the p-value was 0.047. The number of patients in this study was 90 and 103 in the treatment arm and placebo arm, respectively. The mean change in the treatment group and placebo group was reported to be 78 and 23, respectively. Unfortunately, the standard deviations were reported only at baseline and at the final visit, but not for the change from baseline. To calculate the pooled standard deviation for the change in aldosterone used in the t-test, Open the File menu and choose New Calculation. Open the Test Procedures menu and choose Students unpaired t-test Choose the option button Two-sided and among the Interchangeable Parameters options Mean 2* and Sample Size 2 and press OK.
Set the parameter values except for p-value as shown, and then press the Standard Deviation* button.
The textbox for Standard Deviation* will then show the value 190.66, the standard deviation that was used but not reported in the publication.
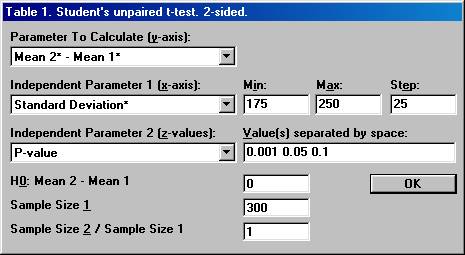
3. Calculation of what observed mean difference will be needed to show a significant difference in the trial. Based on the information found in the literature review and the additional calculations, it was decided that a clinically relevant difference in the mean change of aldosterone should be 50 (pg/mL). However, the true standard deviation seemed to be difficult to assess, but was assumed to be somewhere in the interval 175 to 250. The sample size needed to detect a true difference of 50 (pg/mL) with a probability (power) of 0.80 at a significance level of 0.05 could then be calculated. It turned out that the sample size needed ranged between 193 and 394 per group, depending on the value of the true standard deviation. It was finally decided to run a study with 300 patients in each group. The question was then raised what mean difference in the trial would be needed to get a significant p-value. Open the File menu and choose New Table (or New Graph for a graph). Open the Test Procedures menu and choose Students unpaired t-test Choose the option button Two-sided and among the Interchangeable Parameters options Mean 2* Mean 1*and Size 2 / Size 1 and press OK.
Set the parameter values as shown below and press OK
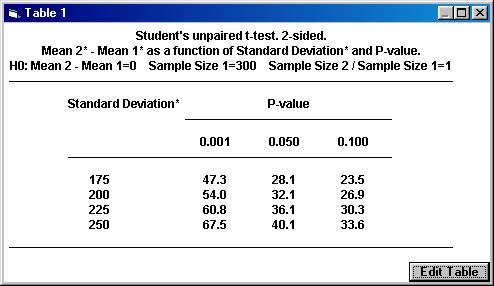
This will create a table (graph) where the mean difference needed in the trial, Mean 2* Mean 1*, is calculated for a range of values for the calculated standard deviation and for three distinct significance levels.
|